Star Charts · Chapter 2 · Stars
2.1 Spectral Classes (K, M) & Hertzsprung-Russell Diagram
Reference data for the cooler spectral classes K and M, listing temperature, composition and an example star for each, plus an explanation of the Hertzsprung-Russell diagram and the main sequence.
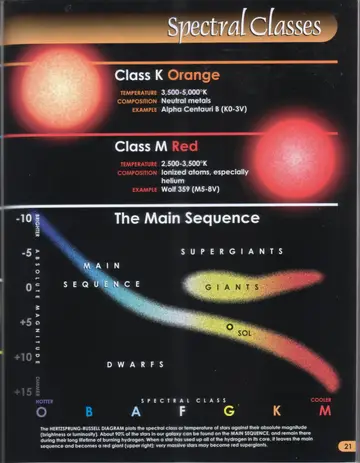
Illustrated comparison of stellar spectral classes K and M, each shown as a glowing star coloured by class with temperature, composition and an example star.
The Hertzsprung-Russell diagram, plotting absolute magnitude (brighter at top, dimmer at bottom) against spectral class O, B, A, F, G, K, M (hotter at left, cooler at right), showing the main sequence, dwarfs, giants and supergiants, with Sol marked on the main sequence.
Class K — Orange
- Temperature: 3,500-5,000°K
- Composition: Neutral metals
- Example: Alpha Centauri B (K0-3V)
Class M — Red
- Temperature: 2,500-3,500°K
- Composition: Ionized atoms, especially helium
- Example: Wolf 359 (M5-8V)
The Main Sequence
The Hertzsprung-Russell diagram plots the spectral class or temperature of stars against their absolute magnitude (brightness or luminosity). About 90% of the stars in our galaxy can be found on the main sequence, and remain there during their long lifetime of burning hydrogen. When a star has used up all of the hydrogen in its core, it leaves the main sequence and becomes a red giant (upper right); very massive stars may become red supergiants.